First Peek at Energy Production Potential for Gulf of Maine Lease Areas
The Bureau of Ocean Energy Management‘s (BOEM’s) auction for Gulf of Maine leases will happen later this year, and we’re providing a sneak peak at estimated waked gross capacity factors (GCFs) for each lease area. Eight different lease areas will be auctioned, as shown in the figure below (credit: BOEM).
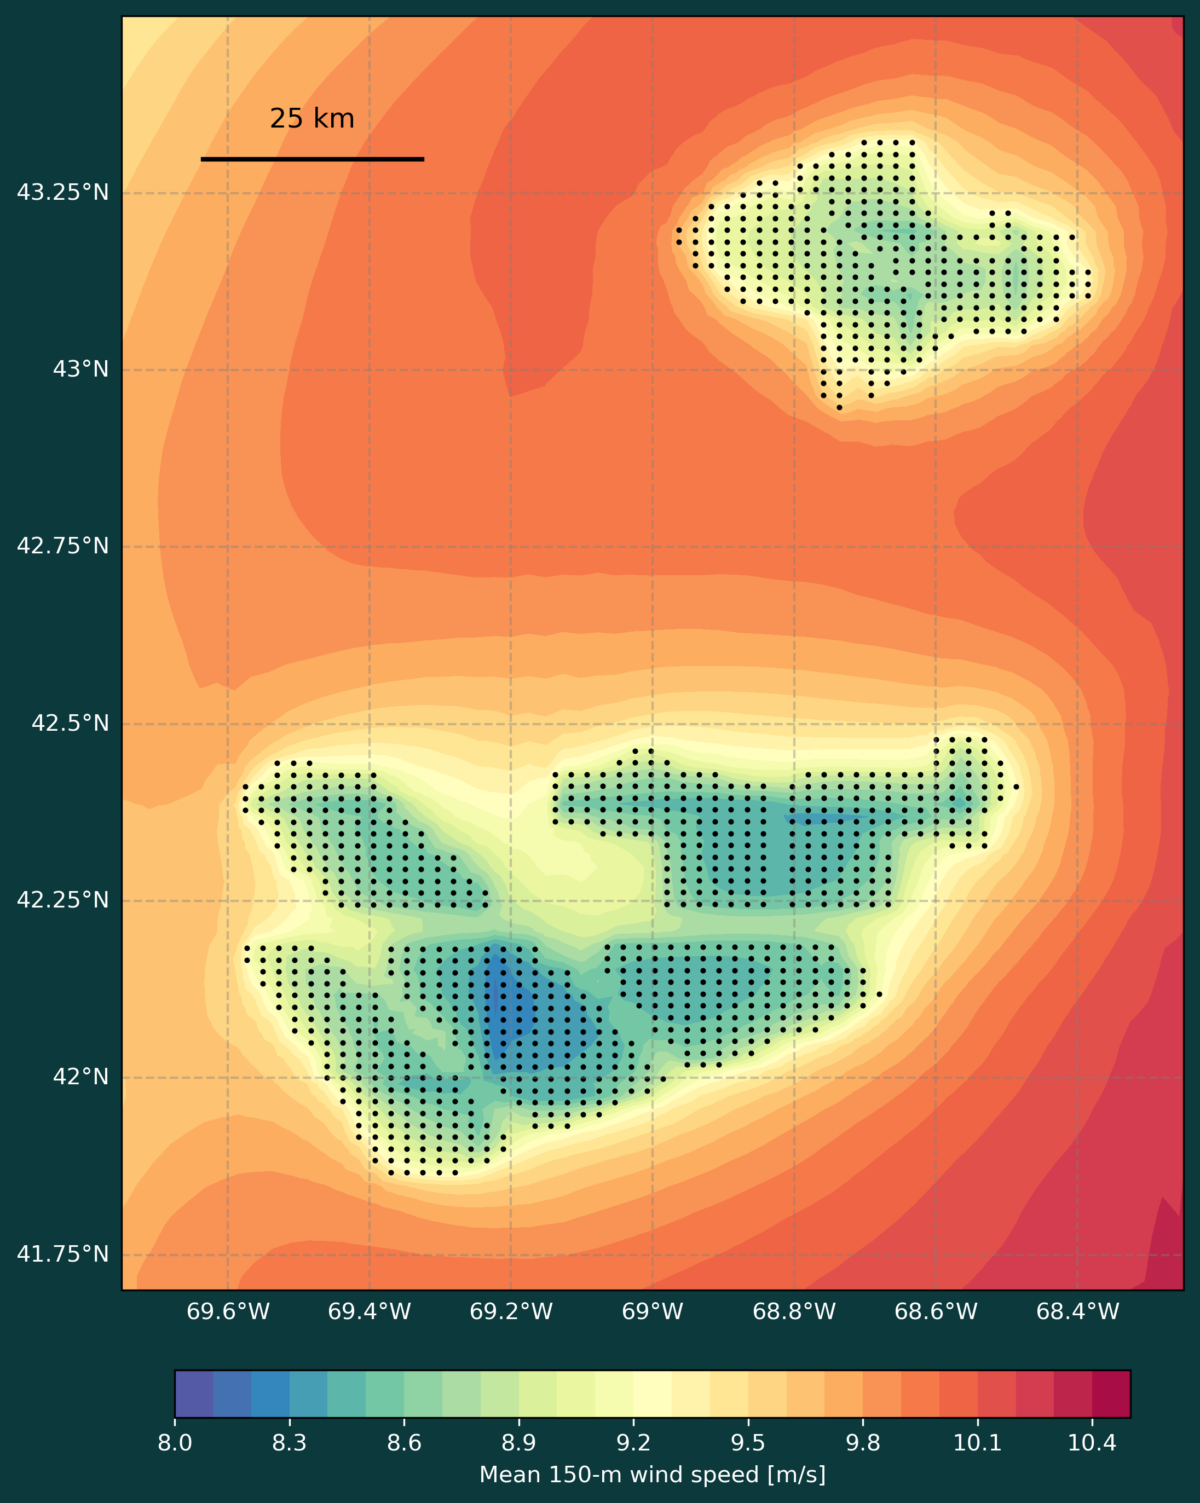
For this domain, we launch a WakeMap typical meteorological year (TMY) simulation at 2-km resolution using the National Renewable Energy Laboratory/International Energy Agency (IEA) 15-MW turbine at 1 nautical mile spacing.
The figure below shows mean wind speeds at 150-m over the TMY. As seen from the figure, deep deficits are observed within the densest clusters, with the OCS-A 0568 area experiencing the most deficit.
To help illustrate the flow through these Gulf of Maine clusters, we show an animation below for a TMY period in June
Overall, we’re seeing better production potential from the more northern lease areas (47.7-49.0% waked GCF) compared to the southern areas (43.9-47.9% waked GCF).
Through our new veerEarth web interface, we’re providing free mean wind speed maps and wind resource grid (WRG) from this simulation. Head to the interface to download the data: https://earth.veer.eco


